AI 概览
Seedream 5.0 能否根据文本提示生成信息图?
可以。Seedream 5.0 Pro 可将结构化简报转化为含多个分区、图表、标签及预设视觉层级的信息图。发布前请务必核对所有事实性内容及小字号文本。
如何在 Seedream 5.0 信息图提示词中正确格式化文字?
每个精确标签均需用英文双引号包裹;多数标签应控制在 3–5 个单词内;并明确说明其位置与字体样式。例如:“总收入:240 万美元”,粗体无衬线体,右上角。
哪些信息图版式最适配 Seedream 5.0?
时间轴、流程图、双栏对比、数据卡片及单图表版式是可靠起点。若制作仪表盘,请为每个图表明确指定网格区域。
Seedream 5.0 信息图提示词中应包含哪些要素?
需明确说明主题与受众、画布宽高比、精确标题、分区数量、提供的数据、各分区对应图表类型,以及克制的配色方案。阅读顺序与风格描述置于末尾。
Seedream 5.0 在信息图生成上的独特之处
Seedream 5.0 Pro 专为解析复杂信息、组织逻辑关系、规划版式布局,并在单次图像工作流中渲染多语言文本而设计。这一组合至关重要——因为信息图不仅需外观精致,其视觉层级、数字、标签与阅读顺序必须协同生效。
通用图像模型常能产出美观海报,但当提示词包含多个关联事实时表现明显弱化。常见缺陷包括虚构数字、图表刻度不一致、图注拥挤或各分区看似互不相关。Seedream 5.0 为您提供更强的初始输出,但仍无法替代人工事实核查或最终排版校验。
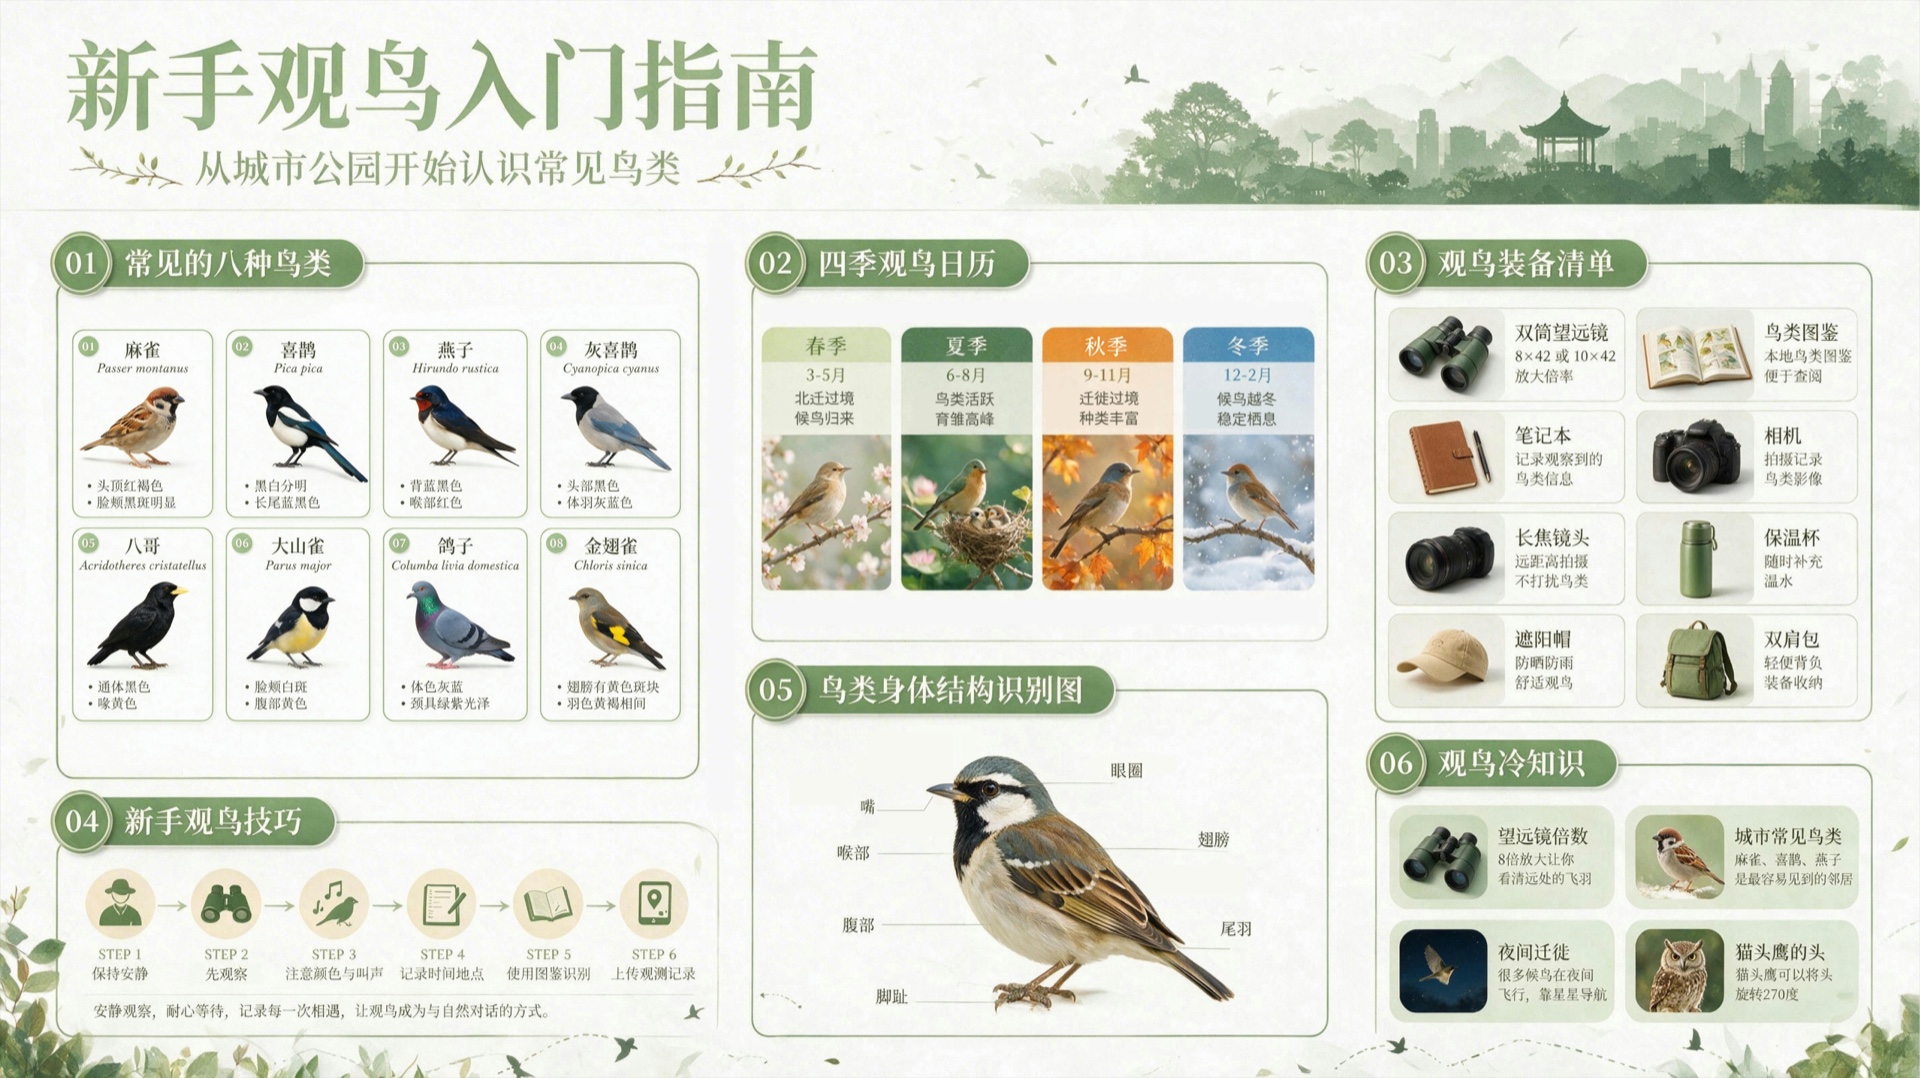
完整信息图示例:网格结构、插画、图标与简短标签共同构建清晰阅读路径,无需依赖大段文字块。
如需更广泛的模型对比,请参阅 Seedream 5.0 vs Nano Banana 2。您也可使用相同简报在 Nano Banana 中测试,保持数据与画布完全一致,从而专注比较版式决策而非提示词差异。
适用于任意信息图的七步提示词公式
一个有效的提示词需按此顺序明确定义以下七项:
- 信息图类型 —— 时间轴、流程图、对比图、数据卡片或图表。
- 主题与受众 —— 该可视化所阐释的内容及其读者对象。
- 画布宽高比 —— 例如 16:9、4:5 或 A4 纵向。
- 精确标题 —— 必须出现在图像中的标题文字。
- 分区数量 —— 页面结构与阅读顺序。
- 各分区的数据与图表类型 —— 提供具体事实;切勿要求模型自行编造。
- 配色方案与视觉风格 —— 控制色彩与设计语言。
使用以下即用型公式:
[Infographic type] about [topic] for [audience], [canvas ratio].
Headline: "[main headline]".
Create [number] clearly separated regions in [reading order].
Region 1: [chart type] showing [data and exact labels].
Repeat for every region. Use only the supplied facts.
Palette: [colors]. Style: [design keywords].
薄弱提示词: “制作一张关于意式浓缩咖啡的信息图。”
优化后提示词:
Vertical 4:5 process infographic for beginner home baristas.
Headline: "Pull Better Espresso".
Create 4 numbered steps from top to bottom: "Dose 18g", "Yield 36g",
"Time 28 Seconds", and "Adjust the Grind". Add one simple line icon per step.
Palette: espresso brown, cream, muted orange. Clean editorial style.
该优化版本为模型提供了版式框架、精确文案、受控事实与统一视觉体系,使有效变体成为可能,同时不牺牲信息架构。
按信息图类型分类的提示词模板
时间轴
Horizontal 16:9 timeline infographic about [topic] for [audience].
Headline: "[headline]". Show [number] milestones from [start] to [end],
left to right. Each milestone has "[date]", "[short label]", and one icon.
Use only supplied milestones. Palette: [colors]. Style: [keywords].
流程图
Vertical 4:5 process infographic explaining [process] to [audience].
Headline: "[headline]". Create [number] numbered steps from top to bottom.
Each step includes "[step name]", one short action, and one icon.
Connect steps with arrows. Palette: [colors]. Style: [keywords].
对比图
Two-column 16:9 comparison infographic for [audience].
Headline: "[headline]". Left column: "[option A]"; right: "[option B]".
Compare [number] aligned rows: [criteria and supplied values].
Use matching icons and equal visual weight. Palette: [colors].
数据突出卡片
Square 1:1 stat-card infographic about [topic].
Headline: "[headline]". Arrange [number] cards in a [grid] grid.
Each card contains one large supplied number, one 3–5 word label,
and one simple icon. Palette: [colors]. Style: [keywords].
数据图表
Clean 16:9 data infographic for [audience]. Headline: "[headline]".
Place one [bar/line/donut] chart in the center using only this dataset:
[paste labels and values]. Label every value directly. Add a one-sentence
takeaway below the chart. Palette: [colors]. No decorative data.
```从 [文生图](/text-to-image) 中的以下结构之一开始,然后仅修改方括号内的字段。保持布局语言稳定,可使提示词测试更轻松。
## 文本内容的正确写法——双引号规则与位置设定
将所有必需的文本内容置于**双引号内**。请将此视作一项实用的提示词规范:它能明确区分需逐字呈现的文字与视觉指令。简短的标签更易精准定位,因此建议控制在 3–5 个词以内;仅在必要时才将说明性文字移至图注(caption)中。
用三个坐标来描述文本:**说什么(内容)、放在哪里(位置)、长什么样(样式)**。例如:`"Q2 营收:240 万美元",右上角卡片,粗体紧凑无衬线字体`。避免使用“在某处添加一个漂亮的标题”之类模糊请求。
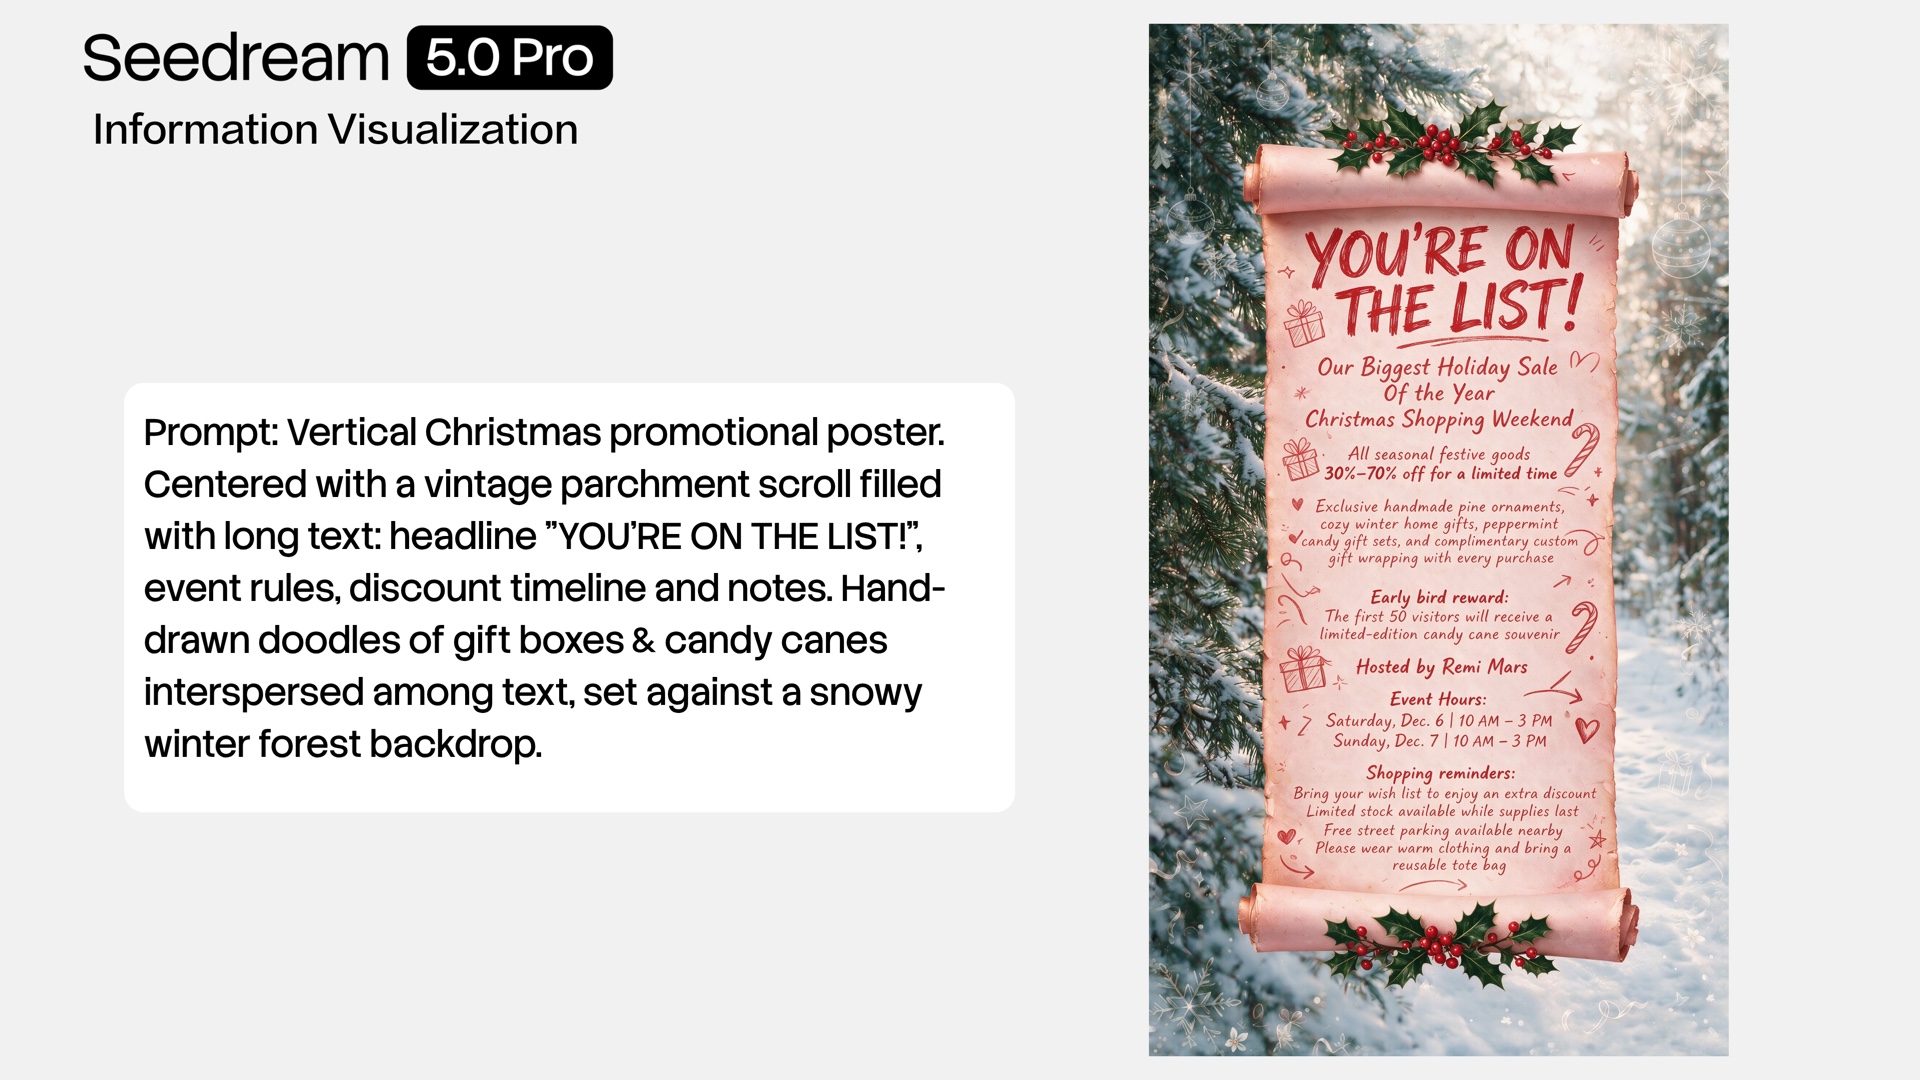
*当标题、折扣信息、日期和行动号召(CTA)各自具备明确定义的角色与位置时,文字密集型海报效果最佳。*
若文本溢出,请缩短标签或扩大其所在区域;若字母显示为乱码,请单独隔离问题标签,并用更少的词重新生成;若文本偏移,请明确指出其容器:“居中于第二张卡片内部”,而非简单写作“居中”。务必在 100% 缩放比例下通读校对。
## 5 种真实应用场景的提示词示例
### 电商产品对比图
```text
Wide 16:9 ecommerce comparison infographic for first-time buyers.
Headline: "Choose Your Daily Bottle". Compare three fictional products—
"Trail 600", "City 750", "Sport 900"—across five rows: capacity
600/750/900 ml, weight 210/260/310 g, insulation 12/18/24 hours,
lid twist/flip/straw, price $24/$32/$39. Use only these values.
Three equal columns, checkmark icons, navy and mint palette, clean store style.
该格式亦可配合 商品摄影 生成的精修目录图共同使用。
社交媒体营销月报
Square 1:1 monthly marketing report for an executive audience.
Headline: "June Growth Snapshot". Create four stat cards in a 2x2 grid:
"Audience Growth +18%", "Conversion 4.6%", "CPM $8.20", "ROAS 3.4x".
Use only these sample values. Add small upward, funnel, cost, and return icons.
Dark navy background, lime accents, high-contrast dashboard style.
产品新手引导流程图
Vertical 4:5 onboarding flow for new project-management app users.
Headline: "Start in Five Steps". Show five connected steps top to bottom:
"Create a Workspace", "Invite Your Team", "Add a Project",
"Assign the First Task", "Review Progress". One simple UI icon per step.
Blue-to-violet palette, rounded cards, friendly SaaS illustration style.
AI 视频行业时间轴
Horizontal 16:9 editorial timeline titled "AI Video: 2020–2026".
Create seven annual milestone slots from 2020 through 2026, left to right.
Use these placeholder labels only: "Research Phase", "Text-to-Video",
"Creator Tools", "Longer Clips", "Better Control", "Agent Workflows",
"Production Systems". Add one icon and one empty caption area per year.
Black, white, and electric blue palette. Do not invent companies or metrics.
发布前,请用经核实的资料替换上述占位里程碑。
教育类科学流程图
Landscape 16:9 classroom flowchart for students aged 10–12.
Headline: "The Water Cycle". Show four clockwise stages:
"Evaporation", "Condensation", "Precipitation", "Collection".
Add ocean, cloud, rain, and river illustrations; connect every stage with arrows.
Include one 5-word caption under each stage. Sky blue, teal, and white palette.
Friendly textbook style, scientifically clear, no extra stages.
常见错误及修正方法
| 错误 | 修正方式 |
|---|---|
| 缺少布局指引 | 明确说明格式类型、区域数量、网格结构及阅读顺序。 |
| 仅有主题,无具体数据 | 粘贴经核实的数据值,并注明“仅使用所提供事实”。 |
| 图表类型模糊 | 明确指定一种图表类型,并将标签与数值一一映射。 |
| 颜色过多 | 将配色限制为两种主色加一种点缀色。 |
| 多个图表但未划分区域 | 为每个图表指定编号卡片或网格单元格。 |
| 未声明宽高比 | 在描述内容前先说明输出画幅比例。 |
切勿仅凭视觉精致度判断结果优劣。请核查:总数是否准确、刻度是否真实、日期是否有序、重复标签是否一致、有无凭空出现的新数字。若准确性至关重要,请先制作数据表格,再将生成图像作为设计草稿使用——而非事实来源。
结论
可靠的资讯图提示词是结构化简报:从五种布局中任选其一,再依次定义目标受众、画布规格、精确标题、分区数量、提供数据、图表类型及配色方案。保持标签简短、所有必需文本加双引号、每个元素明确定位、最终通读校对。简报就绪后,打开 Seedance,用 Seedream 5.0 进行尝试,并每次仅调整一个变量以持续优化。